
Community
Free and open source
- Real-time visibility and top talkers
- Layer-7 application detection (nDPI)
- Alerts, timeseries, network discovery
Stop guessing what is on your network. ntopng turns raw traffic into answers: who is talking, what they run and what looks wrong. Traffic analysis, NetFlow collection, deep packet inspection and an on-prem AI analyst in one console, on your own infrastructure.
Free open source edition. No signup. Your data never leaves your network.
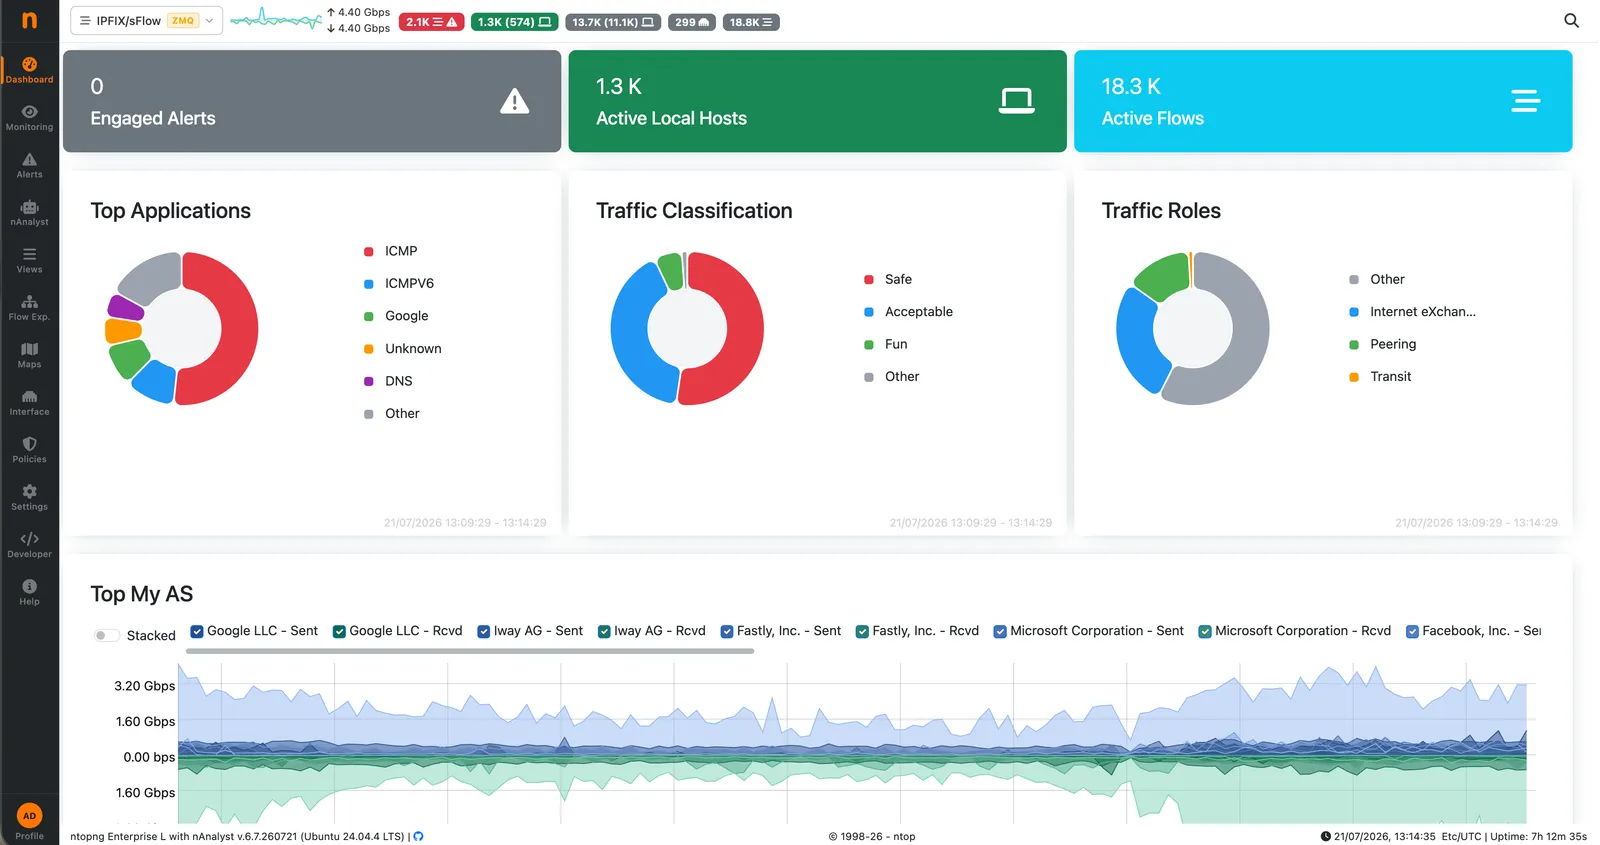
Trusted by 14,000 networks and our technology partners
Meet our partners





Most teams fly blind until something breaks, then lose hours stitching answers together from five tools.
Without per-flow data, teams argue about the cause instead of fixing it.
Everything hides behind port 443. Unknown apps and risky hosts go unnoticed.
Hundreds of alarms and no way to tell the attacker from the noise.
Sending packets and metadata to a third party is a risk you cannot accept.
Ask in plain language and get charts, root causes and an evidence log, all computed on ntopng data inside your own infrastructure. No traffic is sent to a cloud AI service.
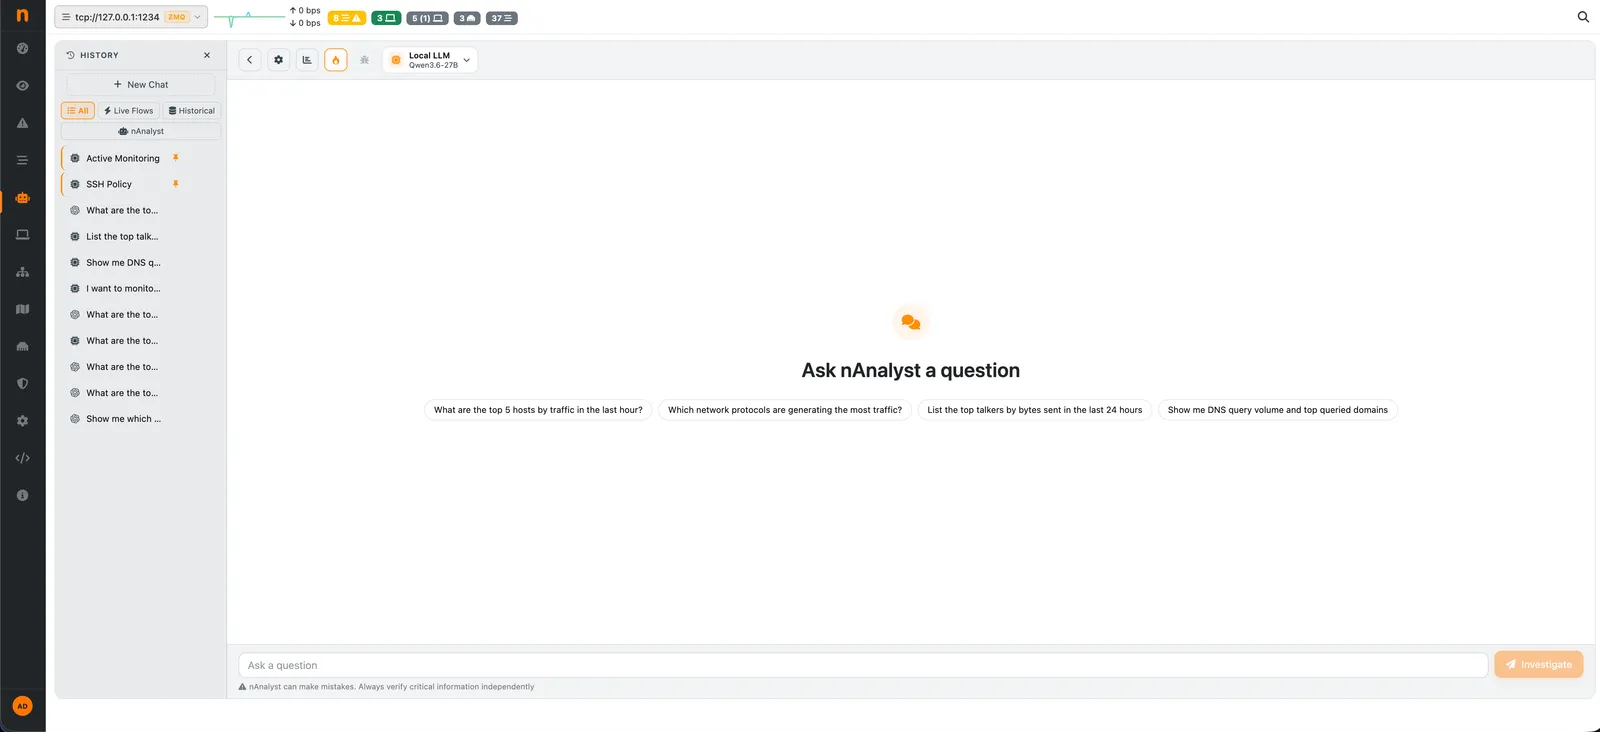
ntopng turns raw traffic into answers. See it, understand it and prove it, without sending a byte outside.
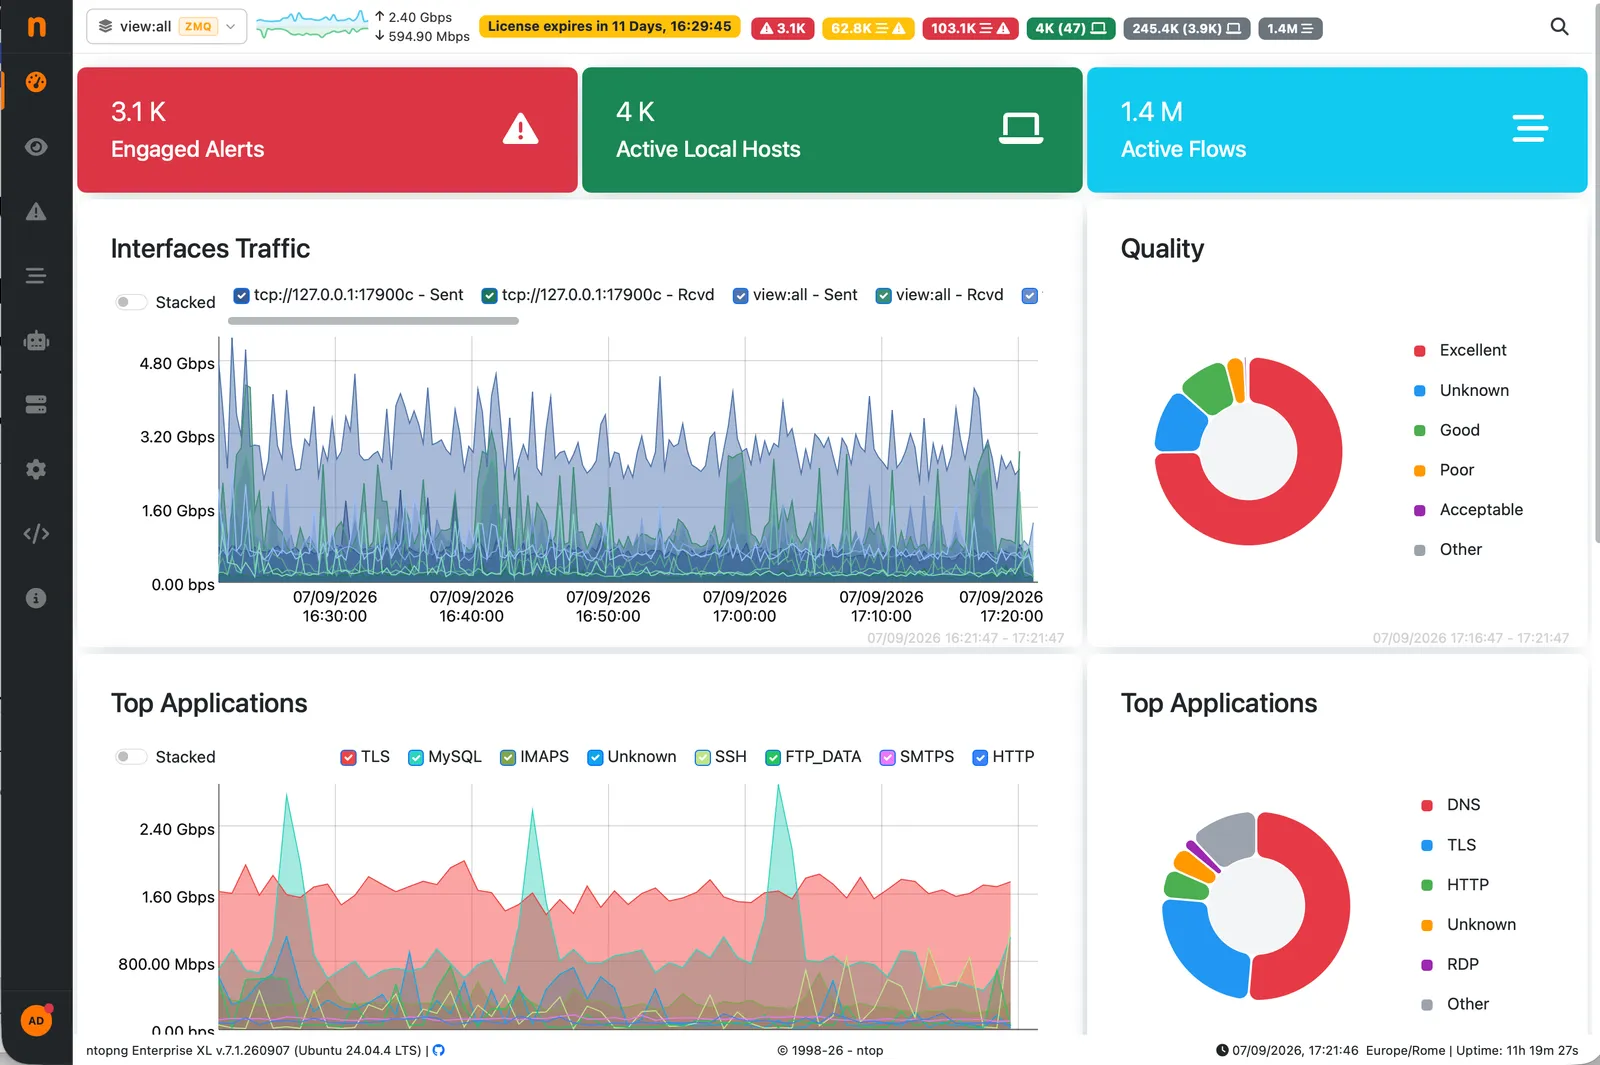
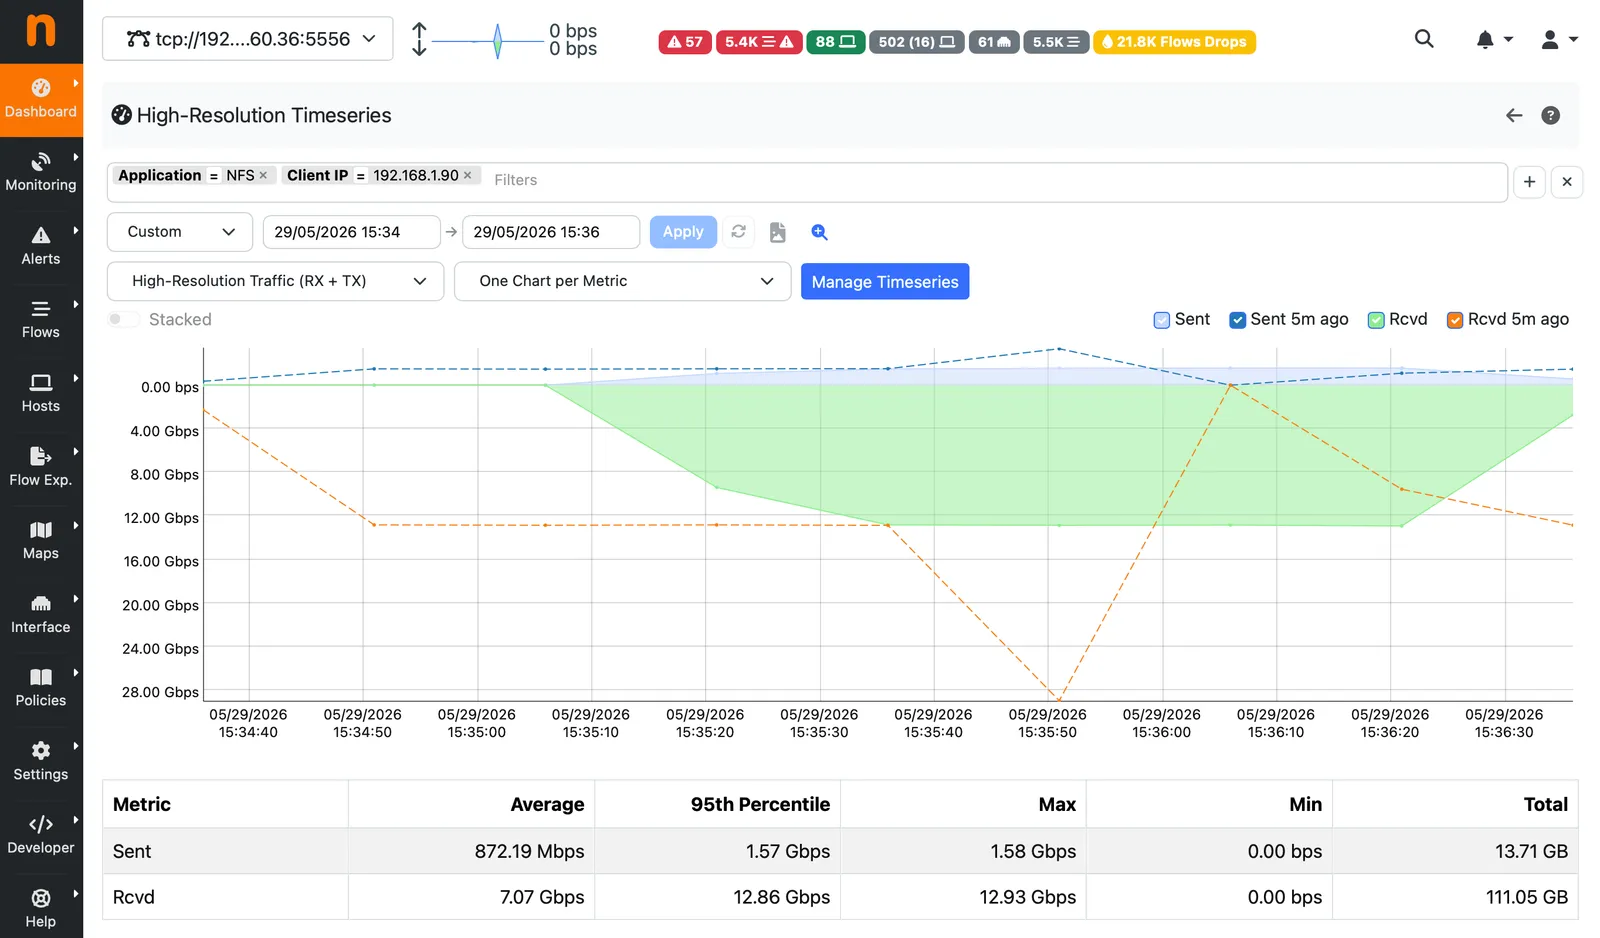
Top talkers, applications, countries and interface throughput update live. Click any chart to drill into the hosts and flows behind it.
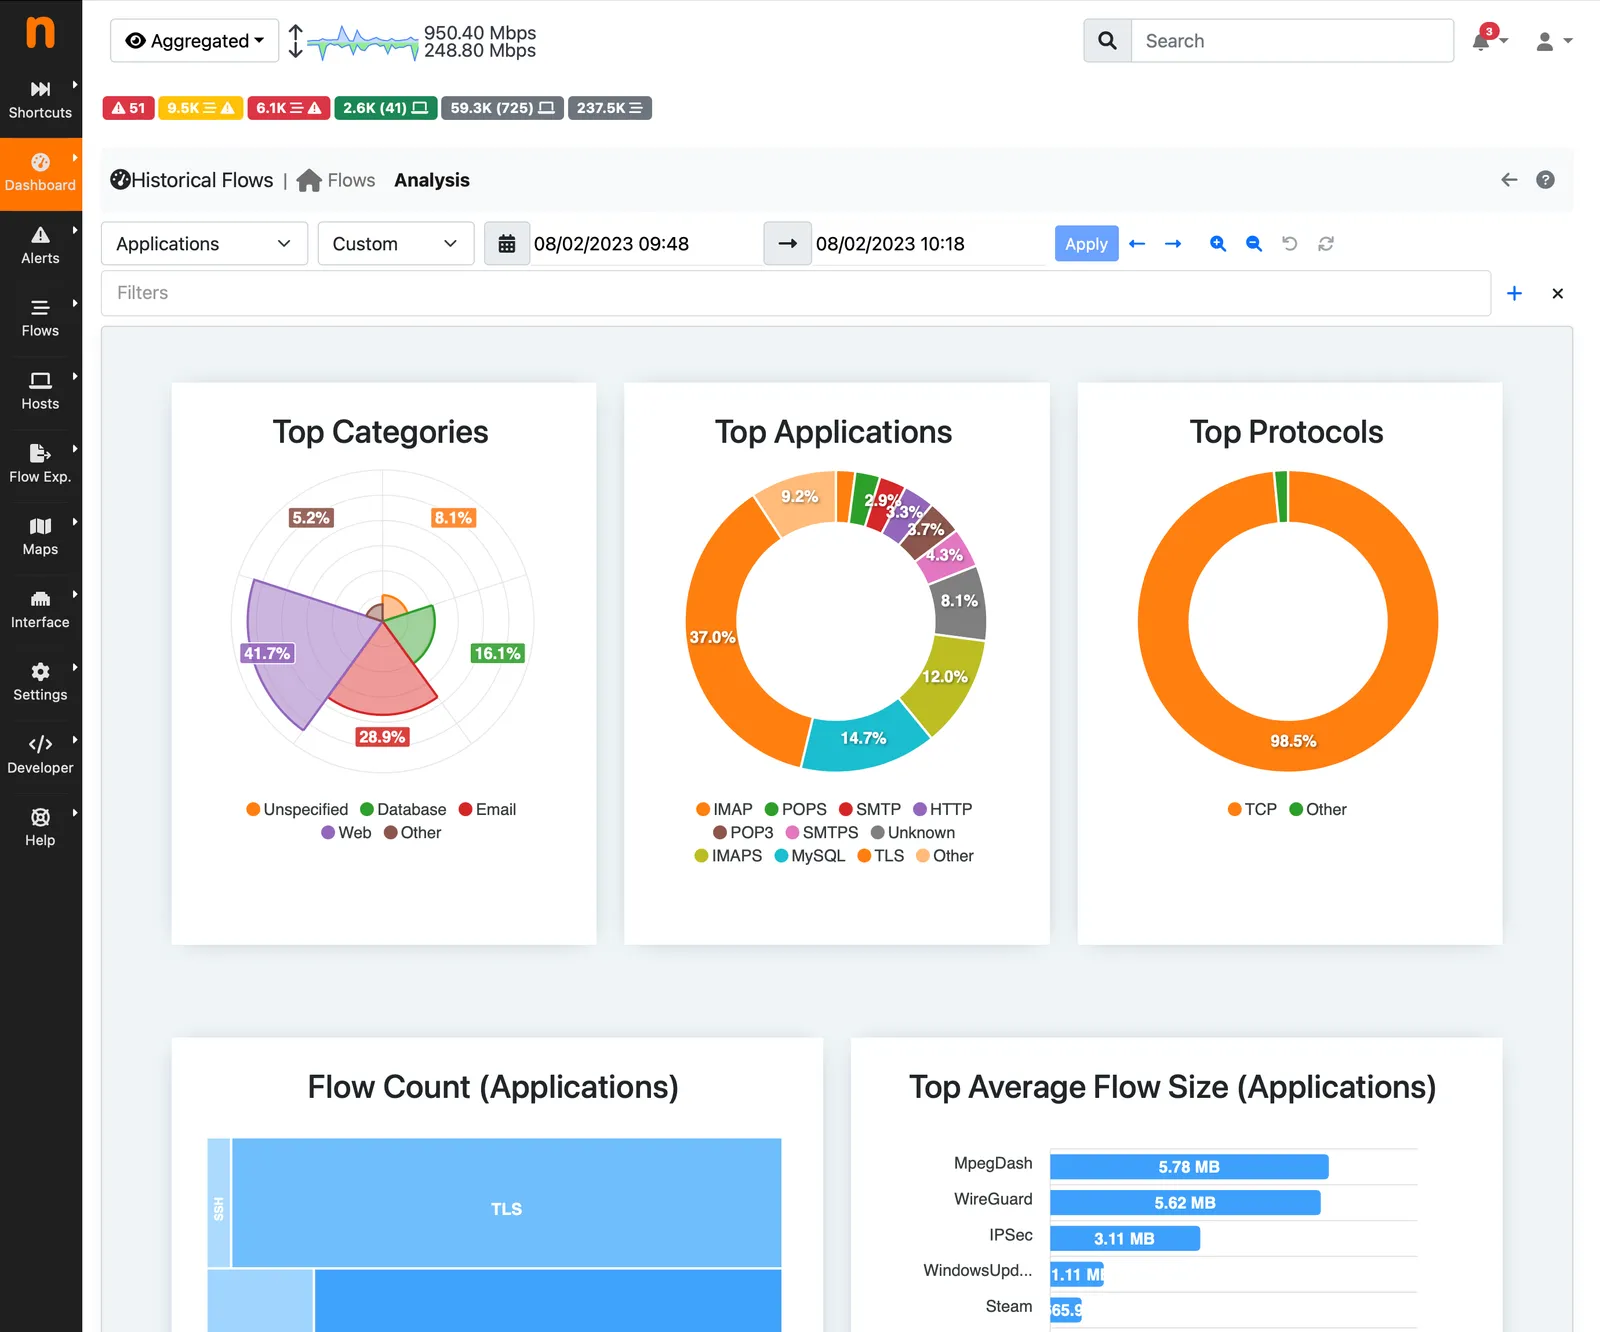
nDPI recognises 450+ protocols, so you see Teams and Netflix, not just port 443, plus TLS, JA4 and DNS metadata.
Hundreds of checks flag anomalies and security issues. The alerts graph shows attackers and victims at a glance, so you start with the biggest risk.
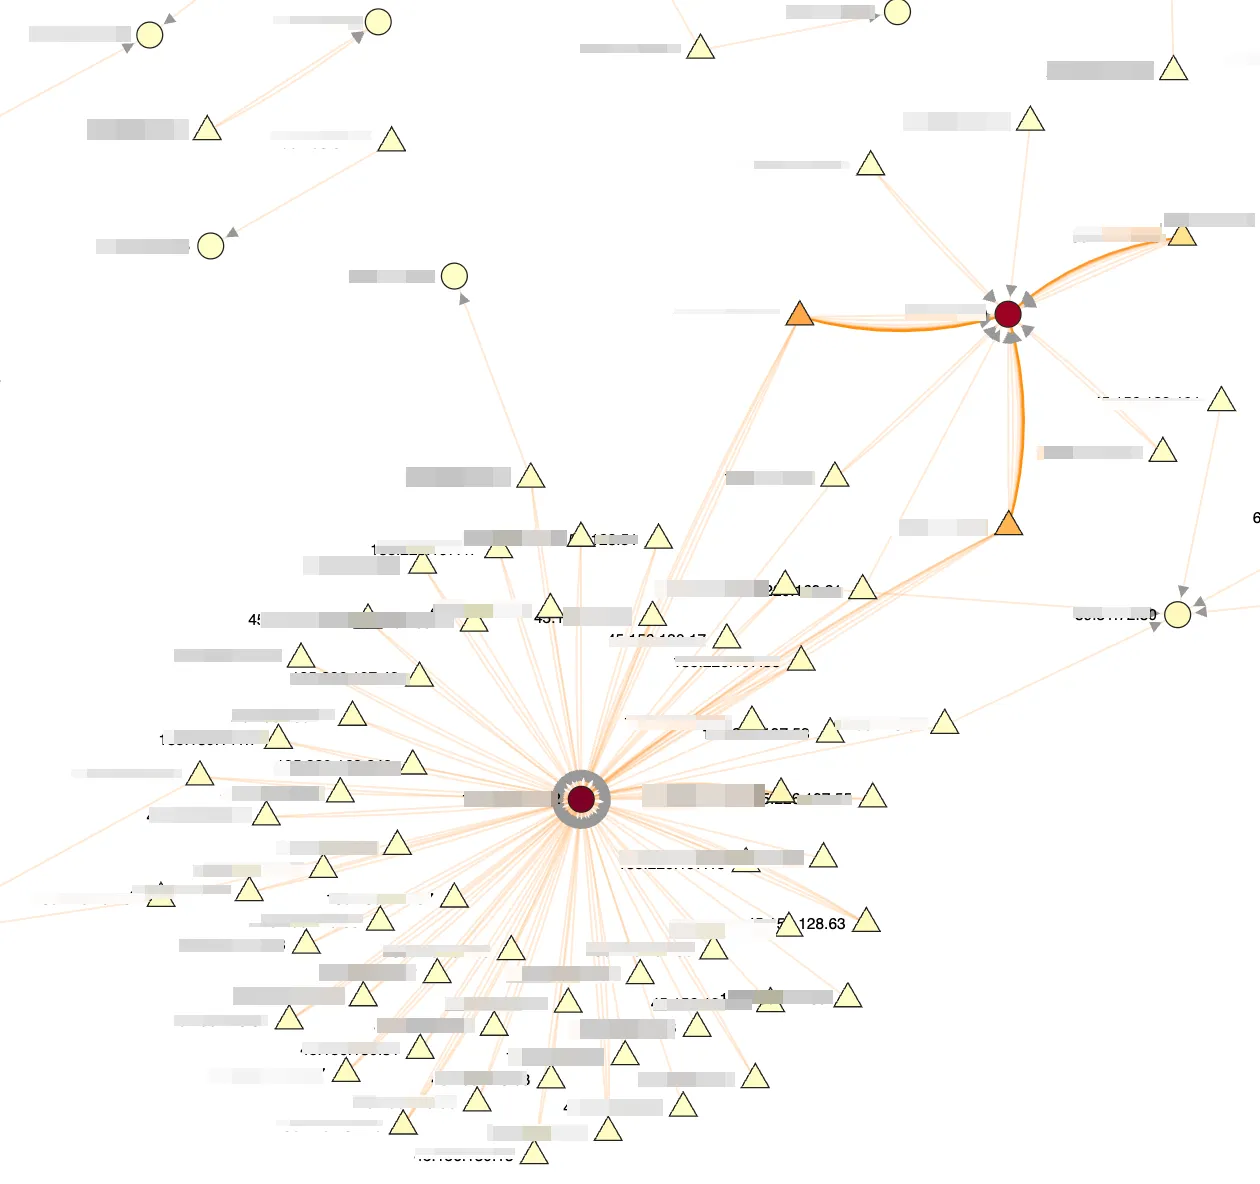
Collect NetFlow, sFlow and IPFIX or capture packets from a mirror port. Keep flows in ClickHouse and chart the past. Pull exact packets with n2disk.
Campuses, branches and the cloud in one console.
Backbone, subscribers and DDoS defense.
Passive visibility for OT and ICS networks.
Self-hosted visibility with audit trails.
Open source building blocks and commercial editions for capture, analysis, recording and protection, designed to work together.
No agents, no cloud account, no sales call.
Add the ntop repository, then install on Linux, Windows, macOS or Raspberry Pi.
sudo apt-get install ntopngUse a mirror port or TAP, or send NetFlow, sFlow or IPFIX from your routers through nProbe.
nprobe --collector-port 2055 --zmq tcp://*:5556Browse to your server on port 3001. Hosts, applications and alerts appear right away.
https://YOUR-IP:3001The Community edition is a complete network visibility tool. Paid editions add scale, reports and integrations.
Free and open source
Everything in Community, plus
Everything in Professional, plus
Earlier this week we have presented at Sharkfest Europe 2026 a presentation of our work about traffic detection of Stealth VPNs and AI Inference. The presentation addresses the challenges of detecting modern obfuscated network traffic, specifically from stealth VPNs and custom/local artificial intel
CVE-2026-98432 is a critical, 9.8-severity use-after-free (UAF) vulnerability in the Linux kernel’s IPv4 TCP networking stack. It allows an unauthenticated remote attacker to potentially cause system crashes, memory corruption, or execute arbitrary commands with root privileges. From a network stand
ntopng has had a search box for a while, but it we made it better to allow search for menu entries too! This to speed up and improve the user experience and…
Still unsure? Read the full FAQ or ask us.
Install ntopng in five minutes and watch your first flows appear. Need scale, licensing or a walkthrough? Our engineers reply fast.
Free Community edition. Open source since 1998. Professional support available.